SERVICES
DASHBOARDS& REPORTING
I make the data a decision needs legible, without rebuilding it every week.
THE SAME WORK, LIVE
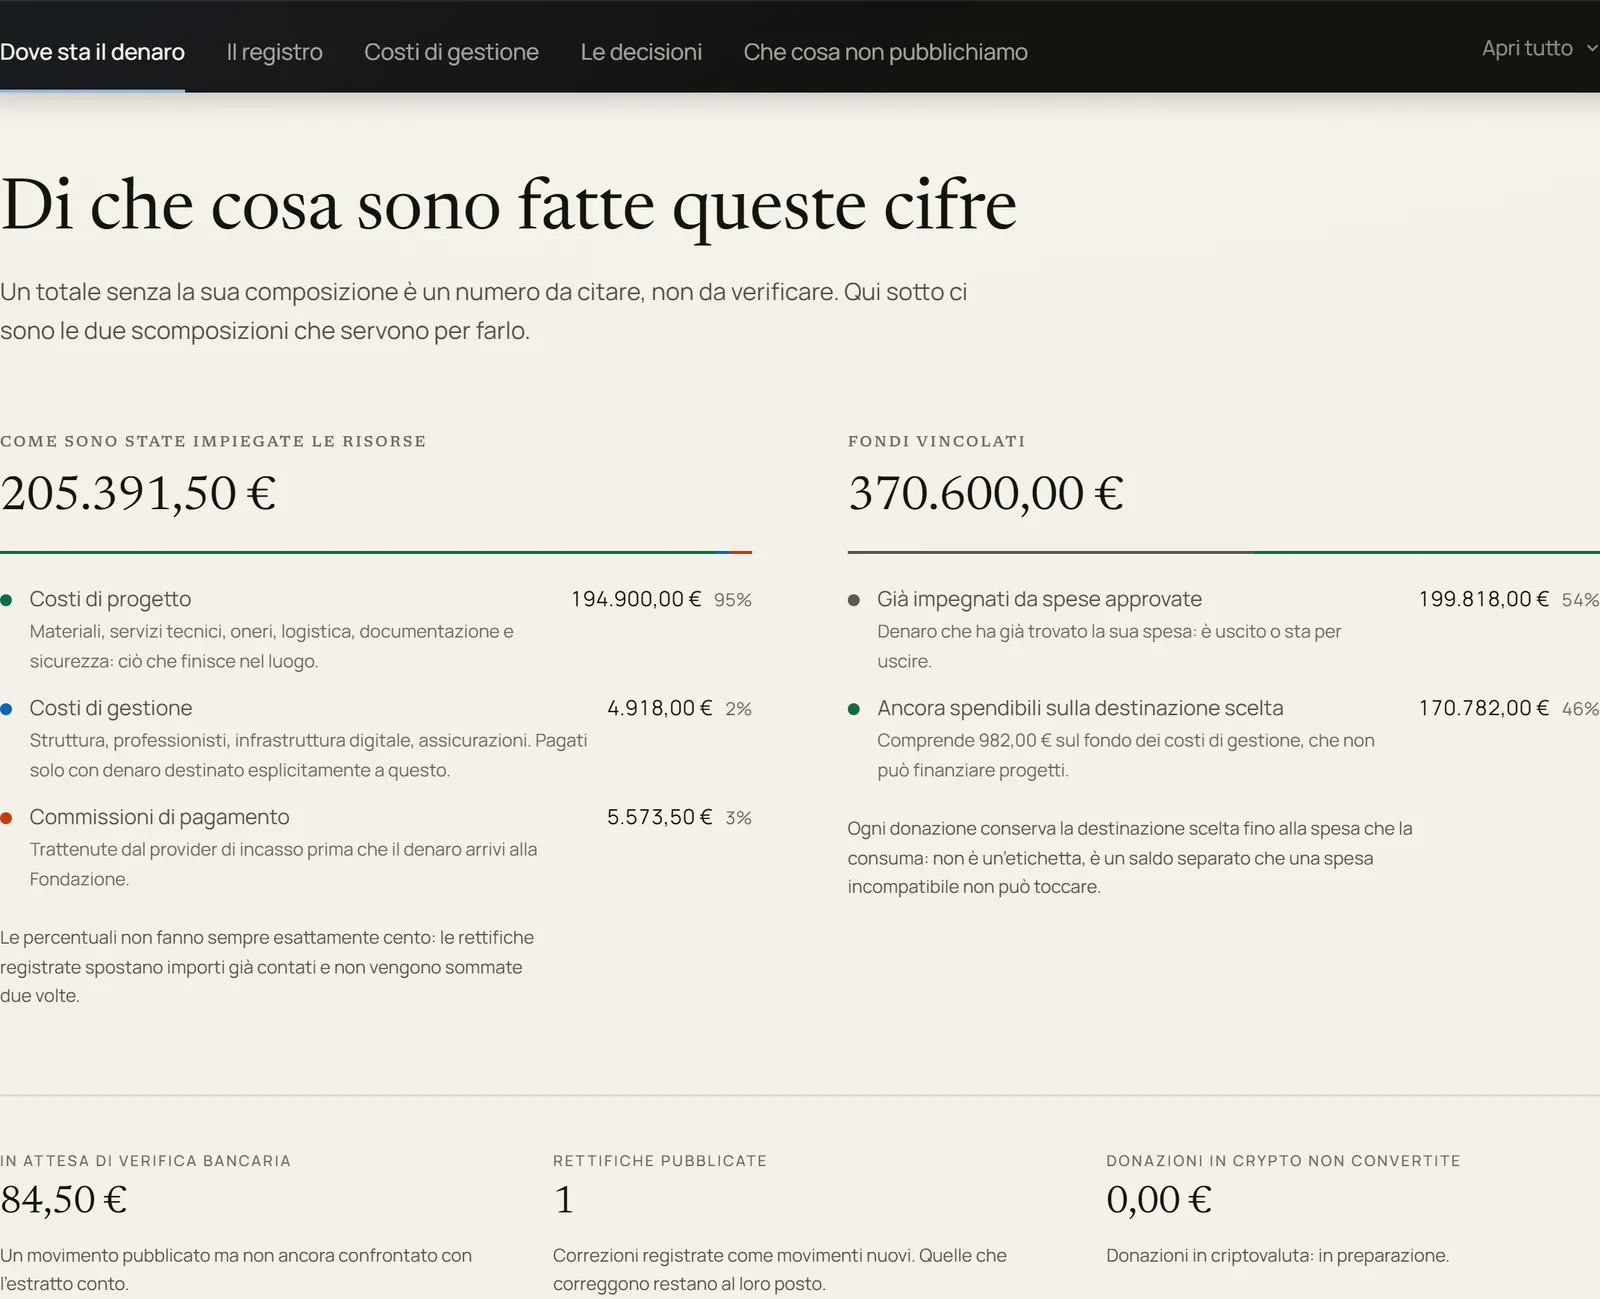
Statement of resources: what came in and what was spent, item by item
FONDAZIONE STELIONThe numbers needed to decide already exist,but scattered across spreadsheets,back-office tools and manual exports.Every report means putting the same sources back together, with the risk that the figures don't match.Decisions arrive late, or get made on numbers that are already stale.
- Defining the indicators that actually matter, not every one available
- Connecting to your existing data sources
- An interface with filters, tables and export
- Empty and error states handled, not blank screens
- QA on the numbers before delivery
- Documentation of what each indicator shows and where it comes from
HOW I WORK
Understand the problem
I start from the decision the dashboard has to make possible, not from the list of charts that would be nice to have.
Define the perimeter
Together we choose the priority indicators, the reliable data sources, and how often they need updating.
Build
I connect the sources, build the interface with filters and export, and handle empty states and missing-data errors.
Make it maintainable
I document what each indicator shows and where it comes from, so the dashboard stays legible even when I'm not the one changing it.
- €2,000 – €14,000
- 2–6 weeks
This isn't a set of nicely styled charts:if an indicator doesn't help someone decide something,it doesn't make the perimeter.
- How many data sources can you connect?
- It depends on how they're structured: a manually exported file is a different job from an authenticated API.More sources, roles or exceptions push the investment towards the advanced tier.
- Does it need maintenance?
- If the dashboard depends on recurring data or an external API, yes — at least minimum monitoring.Support and further development are quoted separately.
- How long does it take?
- Usually 2–6 weeks.The main variable is how clean and accessible the starting data sources are.
Tell me about the process that's jammed — together we choose the right piece to unblock it.
software@stelion.it